What is this Problem?
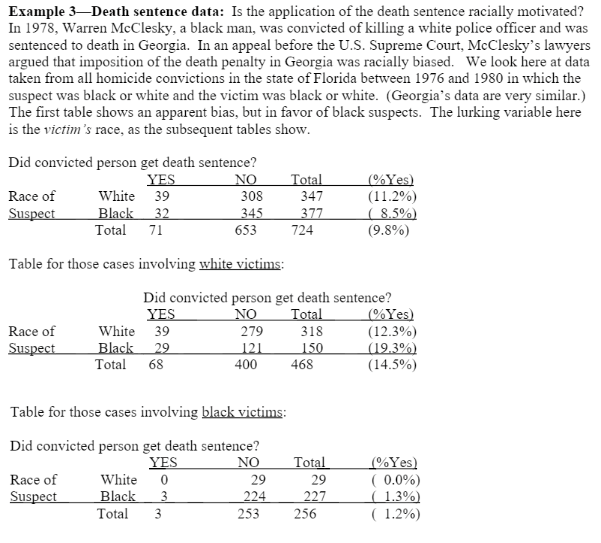
The problem we were working on asked “Is the application of the death sentence racially motivated?” We studied a case from Florida in which the lawyer of the suspect (black suspect who killed a white police officer) gathered information showing all the homicides which happened in Florida. The information had graphs that showed if the suspect was black or white and if the victim was black or white. In the actual court case, McClesky was given the death sentence and killed.
The problem we were working on asked “Is the application of the death sentence racially motivated?” We studied a case from Florida in which the lawyer of the suspect (black suspect who killed a white police officer) gathered information showing all the homicides which happened in Florida. The information had graphs that showed if the suspect was black or white and if the victim was black or white. In the actual court case, McClesky was given the death sentence and killed.
The Process?
The process I went through was study the graphs and see if the lawyer did have a good argument on stating that the death penalty is racially motivated. It was interesting to see where the Simpson's Paradox comes in when you analyze the data separately from white and black individuals than when the data is combined into one graph. This changes the way the graphs look because in one you might think that it doesn't matter but then individually you can see that there is a difference. What I struggled with was trying to understand what the graphs were representing but once understood I was able to understand the data. If you look at the overall data with both black and white victims you can see that the data shows the white victims get the death penalty more often. On the other hand when you separate the data and see both graphs individually you can see that when the victim was white there is a higher death penalty for black individuals than the white. I also thought it was interesting that even if there was only 29 homicides that had a black victim and a white suspect, 0.0% of the suspects were given the death penalty.
Other Students Process?
Other students also realized the change when looking at and comparing both graphs. We compared the entire two graphs combines to the white victim and black subject. You can surley see that when both tables are combined the table you get represents the data differently than when they are apart.
Mr. Tejera's Solution
My teacher observed the same similarities that I did with the data. He mentioned how when looking at the table that has both black and white victims on the same table it looks like when the suspect is white he gets sentenced to death more often than a black suspect but when you separate the data you see how it changed and you can tell that when the victim is white and the suspect is black almost 20% of the suspects get the death penalty. Also when looking at the cases with black victims only 1.2% of all suspects got sentenced to prison and no white suspect was sentenced to prison for killing a black person.
Journal Entry “How does the Simpson’s Paradox effect our lives today?”
The Simpson’s Paradox can really be present in most statistics we see on social media and adds. The paradox can skew the data and present it in a way that the presenter wants you to see it. The presenters of the statistic can therefore prove any point they want by “messing/playing” with the data.
Problem Evaluation
I really enjoyed this problem but mainly learning about the Simpson's Paradox because it's a topic that I had never learned at school and was never thought. It's something nice to carry around because you never know when you'll need to know about it. It was amazing to not only hear about it but actually see how the paradox works and some example problems of how they can affect the world we live in.
Self Evaluation
Even though I was not there when the project was introduced to use because I was at the Jewish New Year holiday services, when I got the heard about the homework I read up all on the paradox and learned when it happens. Reading the explanation of how it happens really made it clear to me seeing the relationship between two separate graphs and what happens when you skew the data. i strongly believe I deserve an A+ for my work on this assignment and all the research I did for it.
 RSS Feed
